Data Design
Source Datasets and Data model.
Intro
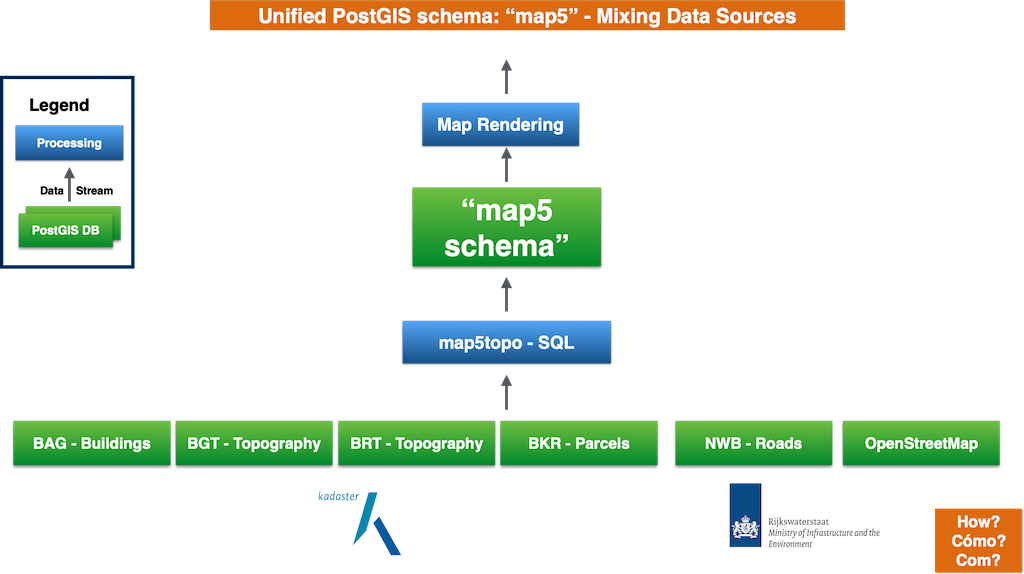
map5topo is composed of multiple (open) datasets. The aim is to fit these all into a single model, (feature) classification and DB-schema.
This is an ongoing process. The name of the (PostGIS) schema is map5.
Tables in this schema are filled with data from other schemas/tables that
contain the various (vector) sources like OpenStreetMap, BRT, BRK, BGT, BAG etc.
SQL scripts are used for this transformation.
Some similar work, common data schemas from various source datasets:
- OpenMapTiles Schema OMT
- PDOK Vector Tiles BGT BRT - Pilot
- Basemap DE Data Model
- Overture Maps Data Schema
Most approaches apply hierarchical feature classification: OMT uses class, subclass, PDOK Vector Tiles Pilot uses
"Level-Of-Detail": lod1, lod2 etc. We like the latter convention as it allows an endless
hierarchy (and is short to type!).
The image below depicts the map5-schema approach. (Click image to enlarge).
Challenges
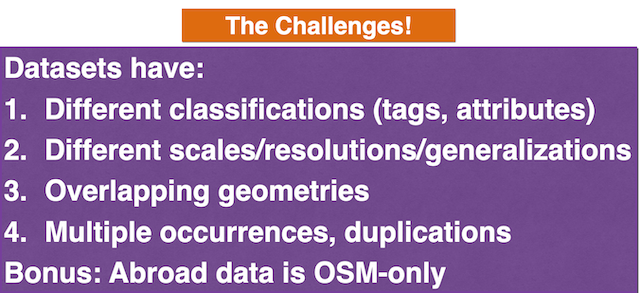
Although reclassification has been exercised in many mapping projects like the ones mentioned above, the extra challenge here is that completely disjunct datasets are used: Dutch Key Registries (BAG, BGT, BRT etc) and OpenStreetMap. Even among Dutch Key registries very different feature classification schemes are in place. For example 'Terrain' (Dutch: 'Terrein') differs in classification among Top10NL and BGT and even is different from Top50NL. Also geometries often do not align, as they originate from different sources and surveying methods, e.g. OpenStreetMap and key registries like BRT and BGT. Geometry-misalignment is even the case among Dutch key-registries, most notably between BRT and BGT. Though work is underway in BRT.Next.
An additional challenge is that the extent of the map includes neighbouring countries. The map of The Netherlands
does not stop at its country-borders!
For neighbouring countries, only data from OpenStreetMap
is available now. Later, local datasets and hillshading from these countries may be added.
The aim is to develop the map from a completely integrated
dataset (tables, layers, styles), i.e. from the "map5 schema". There are no separate tables/layers/styles for neighbouring
countries. Hint: the 'trick' is to mark each record with an abroad boolean attribute (see below).
In summary these are the challenges:
Classification
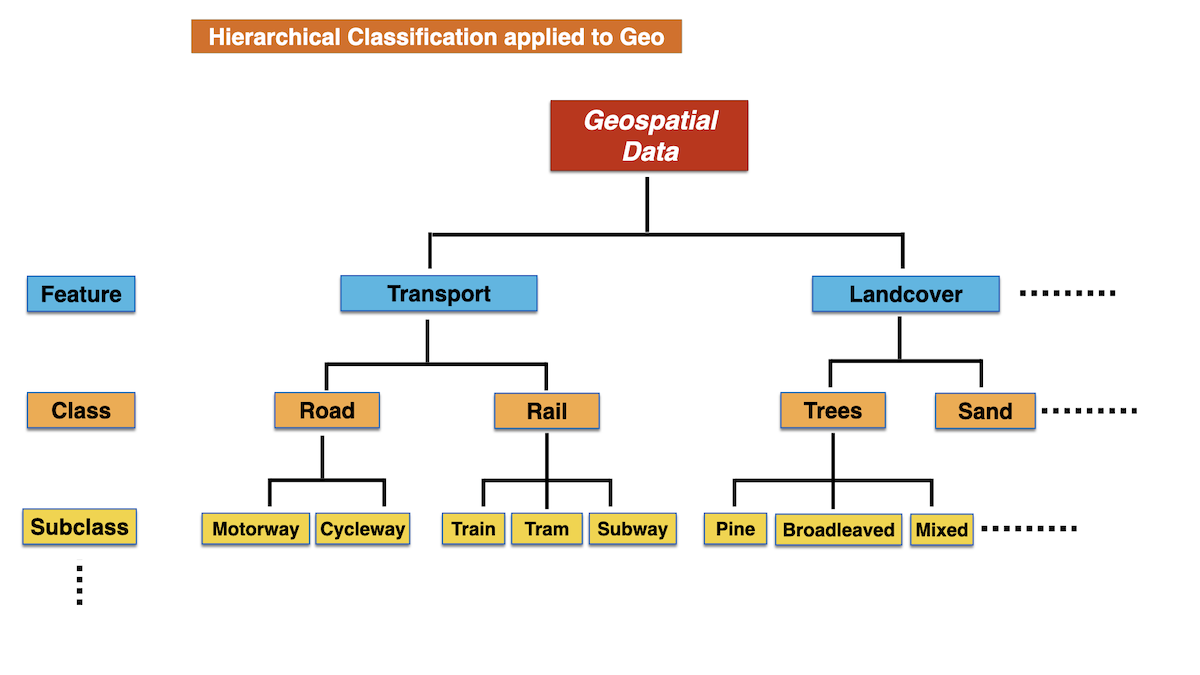
A hierarchical classification is applied, similar to animal and plants classification.
Later, i.s.o. class, subclass "Level-Of-Detail": lod1, lod2 will be used.
Common Data Structure
Each table will follow a common data structure design.
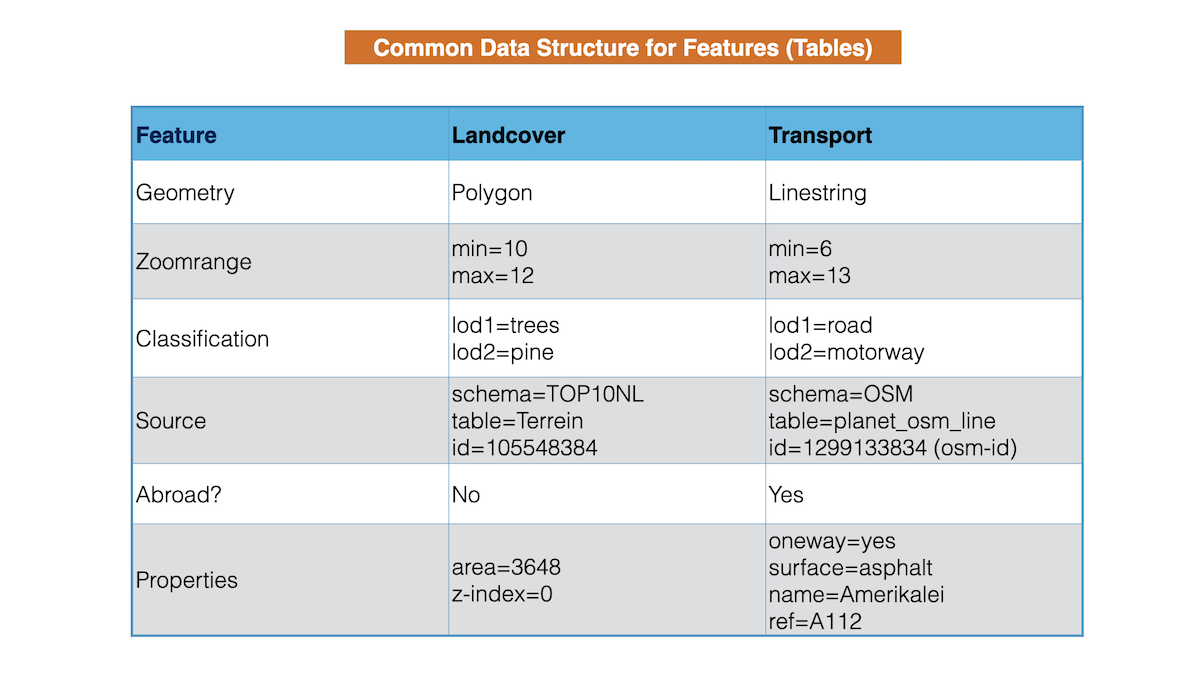
As many features will have specific properties like surface, oneway, bridge (roads), names, population (places), intermittent (water), these are implemented with feature-specific columns.
Tables will be implemented as in image below.
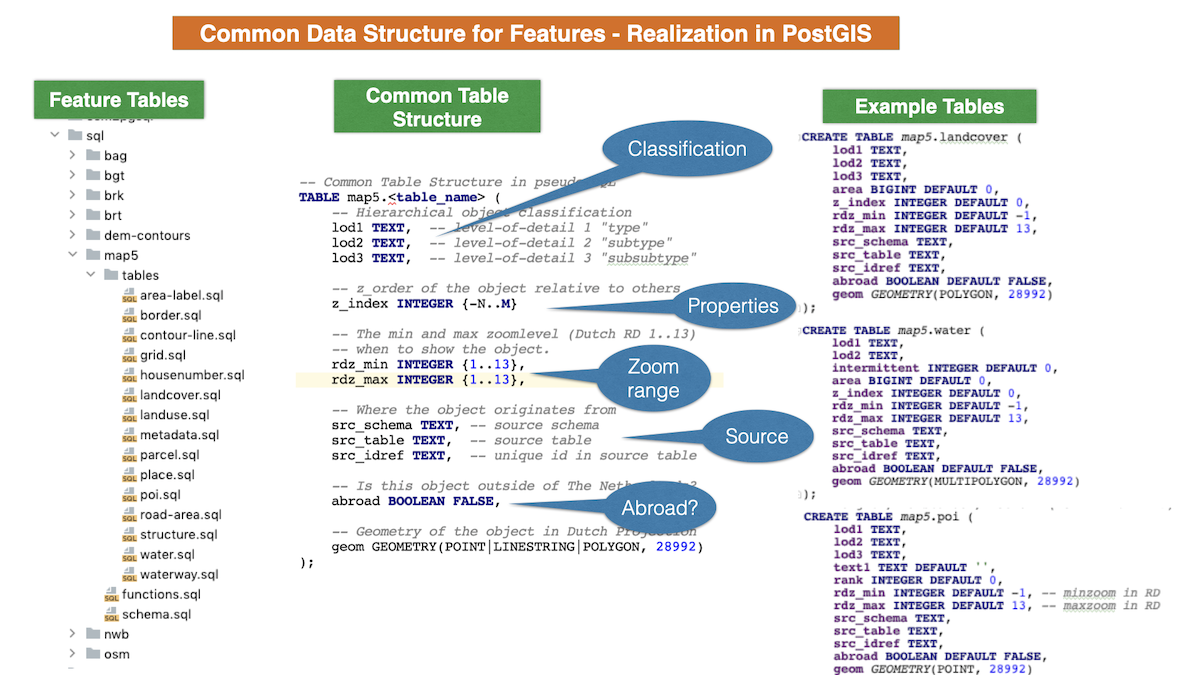
So in summary each table in the map5 schema has a similar setup, i.e. columns:
CREATE TABLE map5.xyz (
    -- table-specific columns, usually classifications, area, population etc
    (lod1-lod3)
    ..
    ..
    ..

    -- COMMON AND FEATURE-SPECIFIC COLUMNS (PROPERTIES)
    --

    -- Relative height
    z_index INTEGER DEFAULT 0,

    -- min and maxzoom in Dutch RD
    -- when to show an object on the map
    rdz_min INTEGER,
    rdz_max INTEGER,

    -- Where the data record originates from
    src_schema TEXT,
    src_table TEXT,
    src_idref TEXT,

    -- Is the object in NL or outside (abroad)?
    abroad BOOLEAN DEFAULT FALSE,

    -- Geometry in Dutch EPSG
    geom GEOMETRY(POINT|POLYGON|LINESTRING, 28992)
);
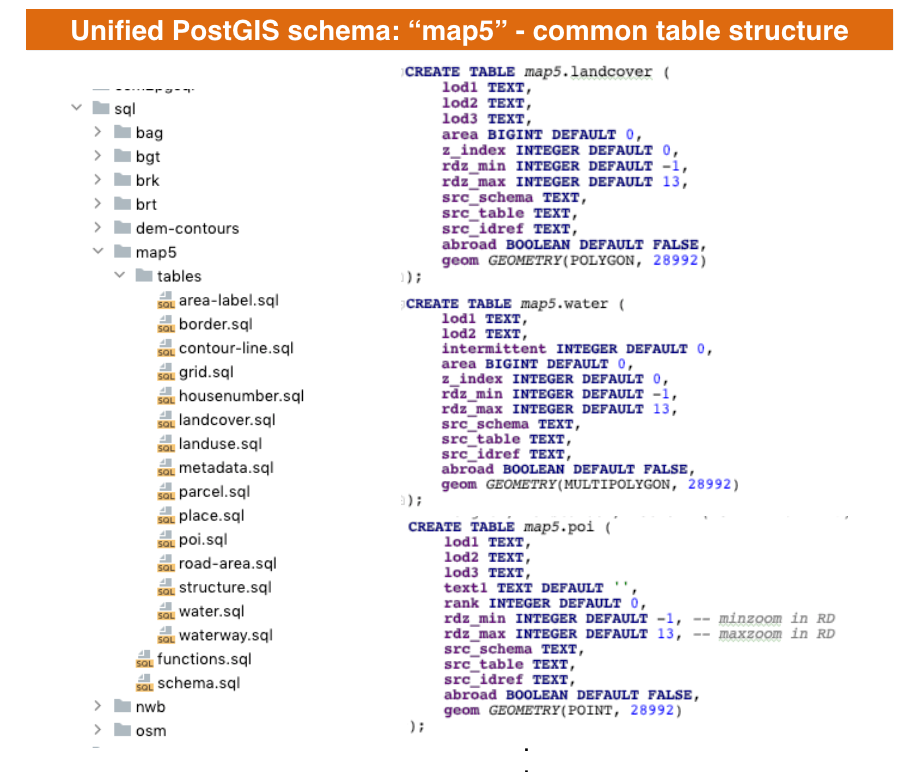
Many tables will contain a classification, like for Landcover or POIs. This is a typical table structure:
CREATE TABLE map5.landcover (
    lod1 TEXT,
    lod2 TEXT,
    lod3 TEXT,
    area BIGINT DEFAULT 0,

    -- Common columns
    z_index INTEGER DEFAULT 0,
    rdz_min INTEGER DEFAULT -1,
    rdz_max INTEGER DEFAULT 13,
    src_schema TEXT,
    src_table TEXT,
    src_idref TEXT,
    abroad BOOLEAN DEFAULT FALSE,
    geom GEOMETRY(POLYGON, 28992)
);
Here lod1 through lod3 provide an hierarchical classification of the
feature. The value-ranges for these columns/attributes are defined per feature type. Each source dataset-specific
classification is mapped to these value ranges. Usually lod1 and lod2 is sufficient, sometimes only lod1.
For example: lod1: trees, lod2: broadleaved|pine|mixed. lod3 contains usually
the source-specific value like naaldbos, mainly for debugging or refined styling.
The image below summarizes this table design. (Click image to enlarge).
Feature Sets
This is the list of map5topo feature sets. Criteria/guidelines:
- Each feature set is a (PostGIS) table.
- Some tables may expand to multiple Layers. For example
transport: Regular, Tunnels and Bridges. - Each feature set/table always has a single geometry type.
- Sometimes multiple tables for same feature type, for example:
transportandtransport_area. - Some, like
housenumber, which are in effect labels, are separate feature sets because of the sheer set's size. - For some names the geometry type is implicit, like
poi(point). - No plural naming like
borders,parcels. - Each record contains metadata on its source origin object: source -dataset, -table, -identifier.
- Each record has a "zoom range", i.e. a min and max zoomlevel in which it should be rendered.
- Multiple geometry simplifications/generalizations of the same feature (thus source-id) may thus appear in single table.
- DEM (Heights): hillshade is not table-based, but separate GeoTIFF raster data.
- DEM (Heights): contour lines are vector data thus table-based.
The list below is not fixed, subject to change based on new insights, or data items that do not fit in any set.
- area_label - point - any that has a name (except house numbers, transport, water)
- border - multipolygon - administrative borders
- contour_line - line - height lines (derived from DEM)
- grid - line - grid lines in map (standard Kadaster RD km lines)
- housenumber - point - clear, also house names
- landcover - polygon - mostly ground level earth covering ("aardbedekking")
- landuse - polygon - functional use of land, like military areas, graveyards, parks
- parcel - line - borders of cadastral parcels
- pitch - polygon - mainly sports pitches - special case of landuse, styled with overlay SVG
- place - point - names of cities, towns up to hamlets
- poi - point - Points of Interest
- seamark - point - navigation aids for water traffic like buoys, beacons and lighthouses, (Dutch: "vaarwegmarkeringen")
- structure - polygon - anything human-built from buildings/houses up to civil tech structures
- structure_line - line - barriers, fences, powerlines
- transport - line - transportation infrastructure: roads, trails, railways, aeroways, ferries etc
- transport_area - polygon - transportation infrastructure areas, road areas, aerodromes, aprons
- valley_label - line - curved labels for valleys (only a few)
- water - multipolygon - water polygons
- water_label - line - water names formed/curved by shapes of waterbodies.
- waterway - line - water lines
- waterway_label - line - waterway names for line-based waterways like rivers and streams
Discussion:
aerowaylike aerodromes (polygon) is always a separate feature set, why? Is here part oftransport_area.- to add to this: aeroway lines are now part of
transport - label sets are based on their type: labels for areas (point), water bodies and valleys (generated curved lines), waterways (line).
ETL
The map5 schema will be populated using SQL as the ETL tool. This is for now simple and quickly to adapt.
The table-SQL for the ETL can be found here.
Zoom-specific Selection
Each table may contain multiple geometry generalizations (simplifications)
for the same object. Per record the zoomlevel range
is specified with rdz_min-rdz_max. Mapnik always provides a scaledenominator
when accessing a Layer. Via the SQL Function rdz() this scaledenominator is
converted to an RD Zoomlevel (range 1-13, equal to WebMerc 6-18) that is used in the query on that Layer.
This way only the relevant records for that zoomlevel are selected.
Many zoom-ranges also have VIEWs, for example for analysis. If needed, for performance, PostgreSQL materialized VIEWs may be applied. But at least data for a single feature type, usually a layer, is not spread over multiple tables now.
For example a VIEW for low-zoom Terrain:
CREATE VIEW map5.landcover_z0_z3 AS SELECT
   lc.*
FROM map5.landcover lc WHERE lc.rdz_min >= 0 AND lc.rdz_max <= 3;
This also works for Web Mercator tiles as scale-ranges are shared, see e.g.
.

.
<!ENTITY maxscale_zoom15_rd10 "<MaxScaleDenominator>20000</MaxScaleDenominator>">
<!ENTITY minscale_zoom15_rd10 "<MinScaleDenominator>10000</MinScaleDenominator>">
<!ENTITY maxscale_zoom16_rd11 "<MaxScaleDenominator>10000</MaxScaleDenominator>">
<!ENTITY minscale_zoom16_rd11 "<MinScaleDenominator>5000</MinScaleDenominator>">
.
.
Using these common ranges allows parallel zoomlevels: for example RD level 11 is 16 in Web Mercator. RD level 13 is WM level 18, the highest level etc. Usually zoom WM = Zoom RD +5.
Abroad
The map area includes data from countries both bordering (Germany, Belgium) and in vicinity
(Northern France) of The Netherlands. By intersecting a (multi)polygon that contains The Netherlands' borders,
in each OSM-record can be marked as located abroad or not This is realized through a simple boolean column,
aptly called abroad. For data from Dutch Key Registries, the fixed abroad value is False.
OSM Source Data
OSM data is downloaded from geofabrik.de, and comprises:
  # The Netherlands
  https://download.geofabrik.de/europe/netherlands-latest.osm.pbf

  # Abroad
  http://download.geofabrik.de/europe/belgium-latest.osm.pbf
  http://download.geofabrik.de/europe/germany/niedersachsen-latest.osm.pbf
  http://download.geofabrik.de/europe/germany/nordrhein-westfalen-latest.osm.pbf
  http://download.geofabrik.de/europe/germany/rheinland-pfalz-latest.osm.pbf
  http://download.geofabrik.de/europe/france/nord-pas-de-calais-latest.osm.pbf

  # Sea
  https://osmdata.openstreetmap.de/download/simplified-water-polygons-split-3857.zip
  https://osmdata.openstreetmap.de/download/water-polygons-split-3857.zip
"The Netherlands" and "Abroad" and stitched together using Osmosis. "Water" data is basically
sea, with exception of Oosterschelde. These are directly converted, using GDAL ogr2ogr, to PostgreSQL PGDump
files for quick reuse.
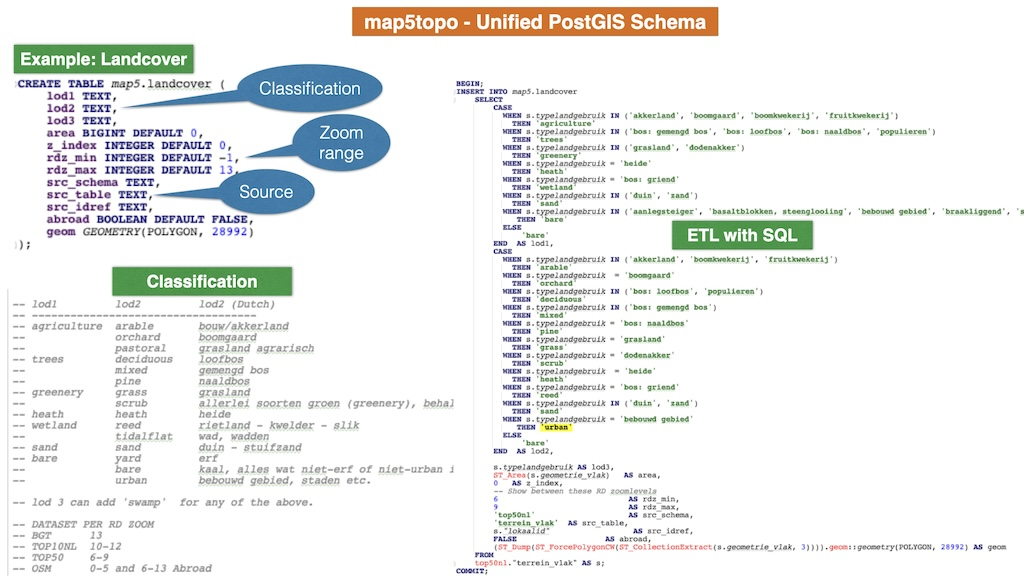
Example Landcover
The image below shows an example for the table map5.landcover ("Landcover" and "Landuse" are separated).
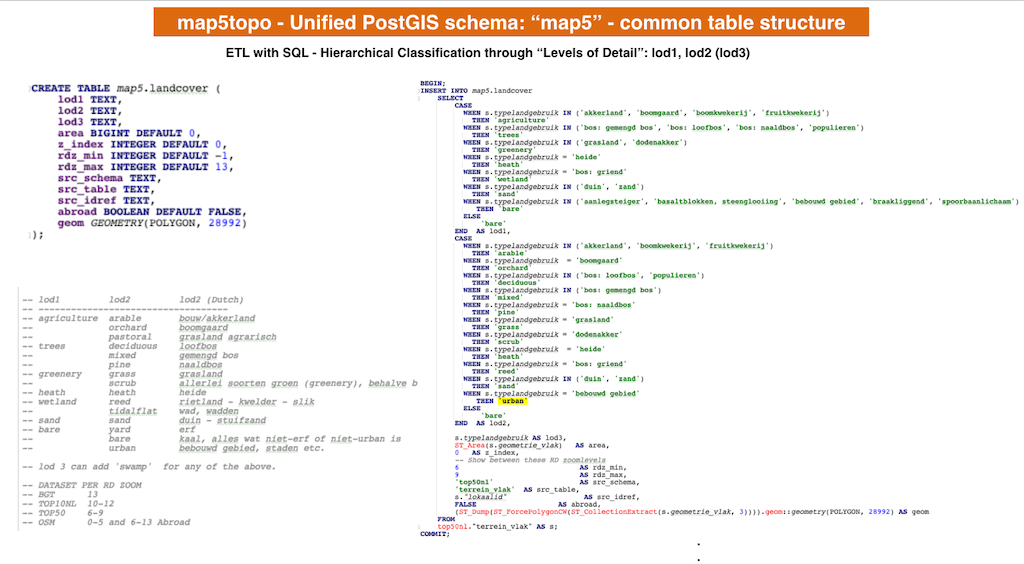
The figure shows the table structure and the hierarchical classification: lod1 and lod2 and their values.
This table is filled from various source tables like BGT and BRT (all "terrain"-related) but also OSM.
Also an excerpt from the map5.landcover.sql ETL is shown, for mapping records from BRT Top50NL.
This mapping is an ongoing process, as the lod-hierarchy needs to be established and mapped
from very different source datasets. Even Dutch Topographic datasets like BRT (smallscale) and BGT (largescale) have
very different feature classification schemes. Also none of the source datasets seems to get the difference
between "Landcover" and "Landuse" right. For example, "orchard" or "graveyard": are these Landcover or Landuse?
This is also an ongoing discussion in the OSM Community, as
this recent Landcover proposal shows.
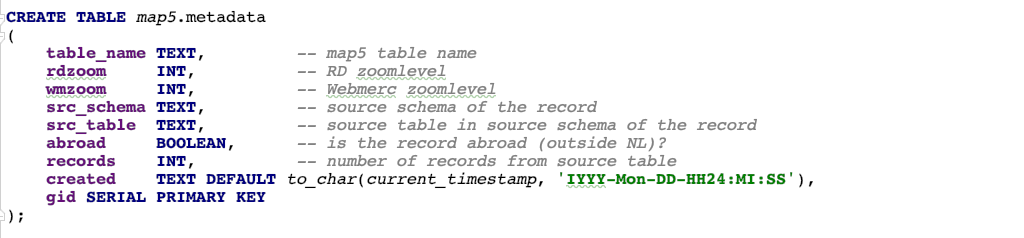
Metadata
Each record within tables in the map5 database schema contains its source schema/table and visibility zoom-range.
This allows for generating metadata such that this information can be made available per zoomlevel, but also other
statistical information like the number of records (at that zoom-level) from a particular source table.
This is exactly what the map5.metadata table beholds. As part of the ETL (SQL) that fills map5. tables from thir source
schemas/tables, a utility SQL function will also insert (replace) records in map5.metadata. The image below shows the
generic setup.
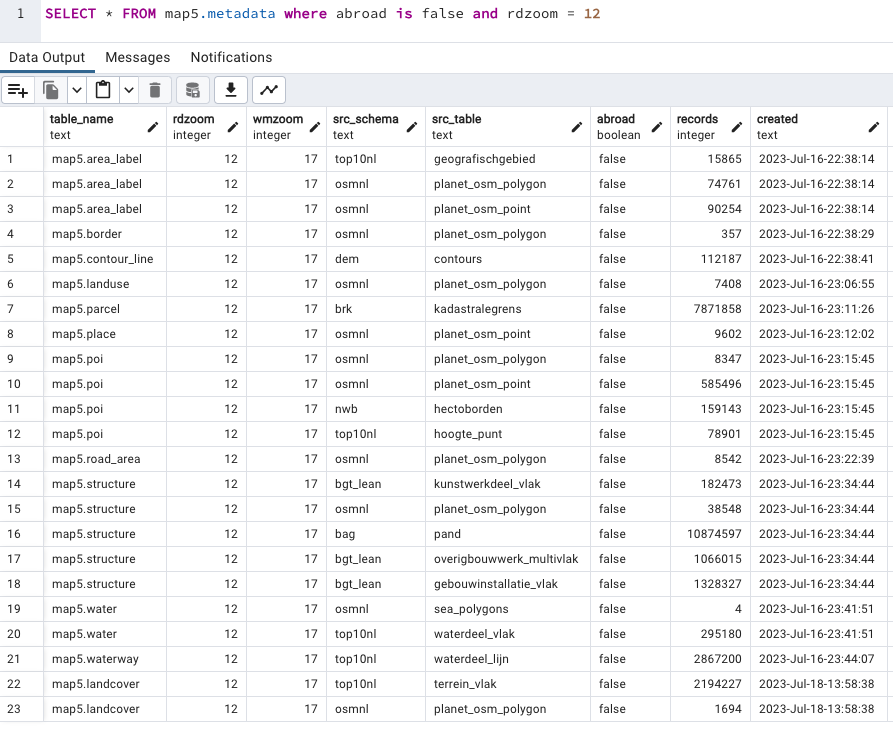
Below an example query: "Show me all information for zoomlevel RD 12 that is not abroad".
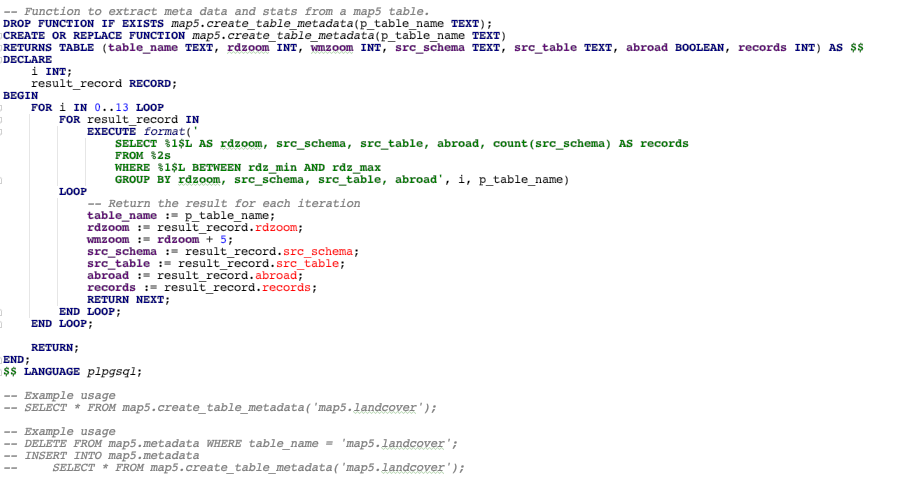
Below is the SQL function called at the end of each map5. table generation, that extracts the relevant metadata
records from that table.
Below are actual classification values, lod1 and lod2 (lod3 is currently only used for original value/tags)
for each table.
| table_name | lod1 | lod2 |
|---|---|---|
| area_label | administrative | |
| area_label | junction | exit |
| area_label | junction | interchange |
| area_label | natural | |
| area_label | other | |
| landcover | agriculture | arable |
| landcover | agriculture | orchard |
| landcover | agriculture | pastoral |
| landcover | bare | bare |
| landcover | bare | reed |
| landcover | bare | urban |
| landcover | bare | yard |
| landcover | greenery | grass |
| landcover | greenery | scrub |
| landcover | heath | heath |
| landcover | sand | reed |
| landcover | sand | sand |
| landcover | trees | deciduous |
| landcover | trees | mixed |
| landcover | trees | pine |
| landcover | wetland | bare |
| landcover | wetland | reed |
| landcover | wetland | scrub |
| landcover | wetland | tidalflat |
| landuse | cemetery | |
| landuse | military | |
| landuse | nature_reserve | |
| landuse | parking | |
| landuse | sport | |
| poi | amenity | hospital |
| poi | distance | hm |
| poi | distance | km |
| poi | height | |
| poi | historic | castle |
| poi | historic | city_gate |
| poi | historic | monument |
| poi | natural | tree |
| poi | place_of_worship | major |
| poi | place_of_worship | shed |
| poi | place_of_worship | wayside_chapel |
| poi | place_of_worship | wayside_shrine |
| poi | station | bus |
| poi | station | metro |
| poi | station | other |
| poi | station | railway |
| poi | station | tram |
| poi | structure | beach_pole |
| poi | structure | gate |
| poi | structure | marker_pole |
| poi | structure | power_generator |
| poi | structure | powertower |
| poi | structure | windmill |
| poi | tourism | camp_site |
| seamark | beacon | beacon_cardinal |
| seamark | beacon | beacon_isolated_danger |
| seamark | beacon | beacon_lateral |
| seamark | beacon | beacon_special_purpose |
| seamark | buoy | buoy_cardinal |
| seamark | buoy | buoy_lateral |
| seamark | buoy | buoy_safe_water |
| seamark | buoy | buoy_special_purpose |
| seamark | light | light_float |
| seamark | light | light_major |
| seamark | light | light_minor |
| structure | building | |
| structure | building_addon | |
| structure | civil_tech | |
| structure | other_building | |
| structure | power_generator | |
| structure | waterholder | |
| structure_line | barrier | ditch |
| structure_line | barrier | fence |
| structure_line | barrier | gate |
| structure_line | barrier | hedge |
| structure_line | barrier | other |
| structure_line | barrier | wall |
| structure_line | powerline | cable |
| structure_line | powerline | major |
| structure_line | powerline | minor |
| structure_line | powerline | other |
| structure_line | powerline | portal |
| transport | aerialway | cable_car |
| transport | aerialway | chair_lift |
| transport | aerialway | drag_lift |
| transport | aerialway | gondola |
| transport | aerialway | goods |
| transport | aerialway | j-bar |
| transport | aerialway | magic_carpet |
| transport | aerialway | platter |
| transport | aerialway | rope_tow |
| transport | aerialway | station |
| transport | aerialway | t-bar |
| transport | aerialway | yes |
| transport | aerialway | zip_line |
| transport | aeroway | abandoned |
| transport | aeroway | aerodrome_marking |
| transport | aeroway | airstrip |
| transport | aeroway | holding_position |
| transport | aeroway | jet_bridge |
| transport | aeroway | model_runway |
| transport | aeroway | navigationaid |
| transport | aeroway | parking_position |
| transport | aeroway | razed |
| transport | aeroway | runway |
| transport | aeroway | stopway |
| transport | aeroway | taxilane |
| transport | aeroway | taxiway |
| transport | rail | blockpost |
| transport | rail | construction |
| transport | rail | crane |
| transport | rail | crane_rail |
| transport | rail | crossing |
| transport | rail | demolished |
| transport | rail | dismantled |
| transport | rail | disused |
| transport | rail | fuel |
| transport | rail | funicular |
| transport | rail | historic |
| transport | rail | hyperloop |
| transport | rail | light_rail |
| transport | rail | loading_rack |
| transport | rail | loading_ramp |
| transport | rail | miniature |
| transport | rail | model |
| transport | rail | modeltrain |
| transport | rail | monorail |
| transport | rail | narrow_gauge |
| transport | rail | no |
| transport | rail | platform |
| transport | rail | platform_edge |
| transport | rail | platform_marker |
| transport | rail | preserved |
| transport | rail | proposed |
| transport | rail | rail |
| transport | rail | razed |
| transport | rail | route |
| transport | rail | signal_box |
| transport | rail | signal_bridge |
| transport | rail | subway |
| transport | rail | tram |
| transport | rail | tram_stop |
| transport | rail | traverser |
| transport | rail | turntable |
| transport | rail | ventilation_shaft |
| transport | rail | yard |
| transport | rail | yes |
| transport | road | cycleway |
| transport | road | footway |
| transport | road | future |
| transport | road | motorway |
| transport | road | motorway_link |
| transport | road | other |
| transport | road | path |
| transport | road | pedestrian |
| transport | road | primary |
| transport | road | primary_link |
| transport | road | residential |
| transport | road | secondary |
| transport | road | secondary_link |
| transport | road | service |
| transport | road | tertiary |
| transport | road | tertiary_link |
| transport | road | trunk |
| transport | road | trunk_link |
| transport | road | unclassified |
| transport | route | ferry |
| transport | trail | bridleway |
| transport | trail | busway |
| transport | trail | cycleway |
| transport | trail | mtb |
| transport | trail | path |
| transport | trail | steps |
| transport | trail | track |
| transport_area | aeroway | aerodrome |
| transport_area | aeroway | airstrip |
| transport_area | aeroway | apron |
| transport_area | aeroway | deicing_pad |
| transport_area | aeroway | fuel |
| transport_area | aeroway | helipad |
| transport_area | aeroway | heliport |
| transport_area | aeroway | marking |
| transport_area | aeroway | model_runway |
| transport_area | aeroway | paragliding_landing_site |
| transport_area | aeroway | parking_position |
| transport_area | aeroway | runway |
| transport_area | aeroway | signal area |
| transport_area | aeroway | signal_area |
| transport_area | aeroway | signal_square |
| transport_area | aeroway | taxilane |
| transport_area | aeroway | taxiway |
| transport_area | bridge_part | support |
| transport_area | bridge_part | surface |
| transport_area | motorized | baan voor vliegverkeer |
| transport_area | motorized | inrit |
| transport_area | motorized | living_street |
| transport_area | motorized | parkeervlak |
| transport_area | motorized | raceway |
| transport_area | motorized | residential |
| transport_area | motorized | rijbaan autosnelweg |
| transport_area | motorized | rijbaan autoweg |
| transport_area | motorized | rijbaan lokale weg |
| transport_area | motorized | rijbaan regionale weg |
| transport_area | motorized | service |
| transport_area | motorized | track |
| transport_area | other | 1 |
| transport_area | other | OV-baan |
| transport_area | other | berm |
| transport_area | other | bridleway |
| transport_area | other | construction |
| transport_area | other | corridor |
| transport_area | other | crossing |
| transport_area | other | cycleway |
| transport_area | other | elevator |
| transport_area | other | emergency_access_point |
| transport_area | other | fietspad |
| transport_area | other | island |
| transport_area | other | overweg |
| transport_area | other | passing_place |
| transport_area | other | proposed |
| transport_area | other | ruiterpad |
| transport_area | other | spoorbaan |
| transport_area | other | tertiary |
| transport_area | other | traffic_island |
| transport_area | other | turntable |
| transport_area | other | unclassified |
| transport_area | other | verkeerseiland |
| transport_area | pedestrian | bus_stop |
| transport_area | pedestrian | footway |
| transport_area | pedestrian | path |
| transport_area | pedestrian | pedestrian |
| transport_area | pedestrian | platform |
| transport_area | pedestrian | rest_area |
| transport_area | pedestrian | services |
| transport_area | pedestrian | steps |
| transport_area | pedestrian | voetgangersgebied |
| transport_area | pedestrian | voetpad |
| transport_area | pedestrian | voetpad op trap |
| transport_area | pedestrian | woonerf |
| water | basin | |
| water | lake | |
| water | other | |
| water | river | |
| water | sea | |
| water_label | bayaxis | bay |
| water_label | lakeaxis | basin |
| water_label | lakeaxis | reservoir |
| water_label | lakeaxis | water |
| water_label | straitaxis | strait |
| waterway | canal | |
| waterway | ditch | |
| waterway | drain | |
| waterway | other | |
| waterway | river | |
| waterway | stream | |
| waterway | weir | |
| waterway_label | canal | |
| waterway_label | ditch | |
| waterway_label | drain | |
| waterway_label | fairway | |
| waterway_label | river | |
| waterway_label | stream |
