Research
Initial and ongoing research. Initially to come to an optimal toolchain, data and map design. Later also reseaarch into performance measurements and optimizations.
Tile Seeding Optimization
Tile seeding especially for Retina (512x512) is a long process with sometimes processes "dying". Sometimes not all tiles are rendered, especially at some lower zoomlevels. Investigated in May 2024 : measuring tile generation performance in order to find bottlenecks.
By isolating the generation of a single tile, the performance in each of its process-steps can be measured. Tile generation is performed by Mapnik from the XML Style files. Mapnik reads the file (once) and then basically performs a series of PostGIS queries, one for each Layer, and then draws the map and generates a tile image.
So first we need to have a way to measure and analyse query times. We do this by both logging queries that take more than N millisecs, typically 1000 and using the Postgres statistics system to actually be able to "query on query times", get the top-N time-consuming queries.
Logging Queries - Standard
First we like to log queries taking over N millisecs.
How to log Postgres query statements but not flood the logfile?
Some hints can be found in this Medium article
The essential lines in postgresql.conf are:
logging_collector = on
log_directory = '/var/log/postgres'
log_filename = '%Y-%m-%d_%H%M%S.log'
log_statement = 'none'
log_min_messages = 'info'
log_min_error_statement = 'info'
log_duration = on
log_min_duration_statement = 2000 # longer two secs see below
log_line_prefix = '%m [%p]: [%l-1] user=%u,db=%d '  # Time, process ID, line number, username, and database name.
The essential line is log_min_duration_statement = <millis>. Instead of log_statement = 'all' to switch on/off we can use a psql statement:
ALTER DATABASE gis SET log_min_duration_statement = 1000;
Switching logging off is sometimes hard, but we found in this article:
ALTER USER gis RESET log_statement;
ALTER DATABASE gis RESET log_statement;
Using the PG statistics system
Each tile/image generation by Mapnik will fire like 20+ queries on the PostgreSQL DB.
Some tables are used for multiple Mapnik Layers, for example landcover both under and over hillshade raster.
Also transport is rendered multiple time like first tunnels, the regular (z_index=0) and bridges.
PostgreSQL has a powerful internal statistics collector.
This can be activated via a shared library called pg_stat_statements.
We found a very useful tutorial by Hans-Jürgen Schönig.
The first thing you have to do is to change shared_preload_libraries in postgresql.conf:
shared_preload_libraries = 'pg_stat_statements'
Then restart PostgreSQL.
Finally, the module can be enabled in your desired database:
CREATE EXTENSION pg_stat_statements;
Listing all possible stats columns: d pg_stat_statements or via SQL :
SELECT
  column_name,
  data_type,
  character_maximum_length,
  is_nullable,
  column_default
FROM
  information_schema.columns
WHERE
  table_name = 'pg_stat_statements';
The last step will deploy a view – we will need to inspect the data collected by the pg_stat_statements machinery.
SELECT calls,
     round(total_exec_time::numeric, 2) AS total_time,
     round(mean_exec_time::numeric, 2) AS mean_time,
     round((100 * total_exec_time / sum(total_exec_time)
                 OVER ())::numeric, 2) AS percentage,
    query
FROM  pg_stat_statements
ORDER BY total_exec_time DESC
LIMIT 100;
Now we can measure stats after generating a tile via MapProxy or image directly with Mapnik. After each test we can reset the stats with this statement:
SELECT pg_stat_statements_reset();
The Tests
Test: zoom RD3 about 75% is taken by two queries on map5.landcover table.
We take test tile nr: zoom=2 x=2 y=1
To render using Mapnik direct:
cd git/tools
./mapnik-render-tile.sh 2 2 1
So the total test is:
-- reset stats
SELECT pg_stat_statements_reset();

-- generate image
./mapnik-render-tile.sh 2 2 1

-- Get statistics, the top100 time consuming queries
SELECT calls,
     round(total_exec_time::numeric, 2) AS total_time,
     round(mean_exec_time::numeric, 2) AS mean_time,
     round((100 * total_exec_time / sum(total_exec_time)
                 OVER ())::numeric, 2) AS percentage,
    query
FROM  pg_stat_statements
ORDER BY total_exec_time DESC
LIMIT 100;

-- then analyse
Main output Mapnik tile rendering direct.
./mapnik-render-tile.sh 2 2 1
mapnik_style=map5topo.xml
loaded Mapnik object time=3.4499104022979736s
render sizes: render_size_tx=1 render_size_ty=1 tiles-at-zoom=4
render coords: p0x=155000.00000000006 p0y=242799.04000000004 p1x=375200.96000000014 p1y=463000.00000000006
env Box2d(155000.00000000006,242799.03999999998,375200.96000000014,463000.00000000006)
zoom=2
scale_denominator=3072000.0000000014
scale=860.1600000000003
time=12.883508920669556s
ALL DONE - output file present as mapnik/output/tile-2-2-1.jpeg
Image rendering takes about 14 seconds! Analysing, thinking it may be the number of records for this zoomlevel:
Current Setting: ST_SimplifyPreserveTopology(s.geom, 600) and area > 50000

select count(*), sum(area) from map5.landcover where rdz_max <= 3;

"count" "sum" 49778 13092259408

stats: `"map5.landcover  2  6793.72 3396.86 74.79`

2 queries taking about 7 seconds and occupying almost 75%!

New Setting: `ST_SimplifyPreserveTopology(s.geom, 6000) and area > 100000`

`select count(*), sum(area) from map5.landcover where rdz_max <= 3;`

"count" "sum" 24815 11365954503

reset stats: `SELECT pg_stat_statements_reset();`
get image
"query" "calls" "total_time"    "mean_time" "percentage"
map5.landcover 2    6841.51 3420.75 75.11
Hardly any difference! Is the bottleneck maybe the total numer of records, almost 20 million, in landcover?
Looking at over 1 second duration:
-- 2024-05-22 15:19:50.505 UTC [257]: [1-1] user=gis,db=gis LOG:  duration: 3589.070 ms
SELECT ST_AsBinary("geom") AS geom,"lod1","lod2" FROM (SELECT geom,lod1,lod2,lod3,rdz_min,rdz_max FROM map5.landcover
                     WHERE (rdz(3.072e+06)) BETWEEN rdz_min AND rdz_max) AS landcover WHERE "geom"
                     && ST_SetSRID('BOX3D(155000.0000000001 275000,300000 463000.0000000001)'::box3d, 28992);

--2024-05-22 15:19:53.342 UTC [257]: [2-1] user=gis,db=gis LOG:  duration: 2832.367 ms
SELECT ST_AsBinary("geom") AS geom,"lod1","lod2" FROM (SELECT geom,lod1,lod2,lod3,rdz_min,rdz_max FROM map5.landcover
                     WHERE (rdz(3.072e+06)) BETWEEN rdz_min AND rdz_max) AS landcover WHERE "geom"
                     && ST_SetSRID('BOX3D(155000.0000000001 275000,300000 463000.0000000001)'::box3d, 28992);

-- 2024-05-22 15:19:55.163 UTC [257]: [3-1] user=gis,db=gis LOG:  duration: 1305.991 ms
SELECT ST_AsBinary("geom") AS geom,"lod2" FROM (SELECT geom,length,lod1,lod2,lod3,oneway,z_index,name,surface,grade,abroad,rdz_min,rdz_max FROM map5.transport
                     WHERE lod1 IN ('road', 'trail')
                    AND (rdz(3.072e+06) BETWEEN rdz_min AND rdz_max)
                    AND (z_index = 0 OR (bridge IS FALSE AND tunnel IS FALSE))
                    ORDER BY (CASE WHEN lod2 IN ('motorway','trunk')
                        THEN 5 WHEN lod2 = 'primary' THEN 1 WHEN lod2 = 'secondary' THEN 2 WHEN lod2='tertiary' THEN 3 ELSE 4 END) DESC
                    ) AS transport_roads WHERE "geom"
                    && ST_SetSRID('BOX3D(155000.0000000001 275000,300000 463000.0000000001)'::box3d, 28992);
Where is the time spent? CPU or I/O ?
Measuring I/O time is simple. The track_io_timing parameter can be adjusted to measure this vital KPI. You can turn it on in postgresql.conf for the entire server, or simply adjust things on the database level if you want more fine-grained data:
ALTER DATABASE gis SET track_io_timing = on;

SELECT total_exec_time,
            blk_read_time,
            blk_write_time,
            query
FROM pg_stat_statements
ORDER BY blk_read_time + blk_write_time DESC
LIMIT 10;
But in the end, as is often the case, this is usually a matter of setting indexes.
Although there is a spatial index on geom, EXPLAIN shows that most of the query time is
spent on the BETWEEN rdz_min AND rdz_max as for lowzoom-queries about 4 million rows need to
be matched on the 'heap' returned from the spatial-bbox selection.
Setting indexes like:
CREATE INDEX map5_landcover_rdz_min_idx ON map5.landcover USING btree (rdz_min);
CREATE INDEX map5_landcover_rdz_max_idx ON map5.landcover USING btree (rdz_max);
reduces the query time until order of 100 millisecs! Albeit with a few 100 MB of index space.
We set these for now on landcover, structure and water.
Again we do the test, logging only queries over 1 second.
./mapnik-render-tile.sh 2 2 1
mapnik_style=map5topo.xml
loaded Mapnik object time=2.7876768112182617s
render sizes: render_size_tx=1 render_size_ty=1 tiles-at-zoom=4
render coords: p0x=155000.00000000006 p0y=242799.04000000004 p1x=375200.96000000014 p1y=463000.00000000006
env Box2d(155000.00000000006,242799.03999999998,375200.96000000014,463000.00000000006)
zoom=2 scale_denominator=3072000.0000000014
scale=860.1600000000003
time=4.631199836730957s
ALL DONE - output file present as mapnik/output/tile-2-2-1.jpeg
2024-05-23 12:30:03.312 UTC [4275]: [1-1] user=gis,db=gis LOG:  duration: 1390.031 ms
SELECT ST_AsBinary("geom") AS geom,"lod2" FROM
(SELECT geom,length,lod1,lod2,lod3,oneway,z_index,name,surface,grade,abroad,rdz_min,rdz_max FROM map5.transport
                     WHERE lod1 IN ('road', 'trail')
                    AND (rdz(3.072e+06) BETWEEN rdz_min AND rdz_max)
                    AND (z_index = 0 OR (bridge IS FALSE AND tunnel IS FALSE))
                    ORDER BY (CASE WHEN lod2 IN ('motorway','trunk') THEN 5 WHEN lod2 = 'primary' THEN 1 WHEN lod2 = 'secondary' THEN 2 WHEN lod2='tertiary' THEN 3 ELSE 4 END) DESC
                    ) AS transport_roads WHERE "geom" && ST_SetSRID('BOX3D(155000.0000000001 275000,300000 463000.0000000001)'::box3d, 28992)
So we index transport as well, though here we may need indexing on lod1 and lod2 as well...and the rendering time is now 0.8sec!
So index,index,index is the answer!
Final run after not even indexes set on all map5-tables:
./mapnik-render-tile.sh 2 2 1
mapnik_style=map5topo.xml
loaded Mapnik object time=1.9455204010009766s
render sizes: render_size_tx=1 render_size_ty=1 tiles-at-zoom=4
render coords: p0x=155000.00000000006 p0y=242799.04000000004 p1x=375200.96000000014 p1y=463000.00000000006
env Box2d(155000.00000000006,242799.03999999998,375200.96000000014,463000.00000000006)
zoom=2
scale_denominator=3072000.0000000014
scale=860.1600000000003
time=0.821070671081543s
ALL DONE - output file present as mapnik/output/tile-2-2-1.jpeg
CONCLUSION: reduced rendering time from 14 seconds to 0.8 by simply indexing mainly min_rdz and max_rdz, the per-record zoomrange!
GeoPackage Tile Storing
Apart from the DB query and Mapnik rendering storing tiles in GeoPackage also contributes to total tile seeding performance. Too slow often like 1500-5000 tiles/minute (even after Mapnik and PostGIS optimized as above). There must be other bottlenecks
Analysis
Apart from disabling cache lock (remove --use-cache-lock) in MP seeder script, some simple sqlite PRAGMA settings increased speed enormously:
We found a huge optimization in store time by using these two PRAGMA's:
self._db_conn_cache.db.execute('PRAGMA synchronous=OFF')
self._db_conn_cache.db.execute('PRAGMA journal_mode=MEMORY')
and with PRAGMA's up to 45000-60000 tiles/min!
So about a 10-fold performance improvement. Question: how safe are these PRAGMAs?
Tile Serving Performance
Question is: tiles are served from huge caches, but there appear to be no indexes...
Tests using Apache Benchmark (ab).
ab -n 1000 -c 50 https://s.test.map5.nl/map/map5.demo11/tms/1.0.0/map5topo/EPSG28992/6/27/30.jpeg
Without Indexes
Concurrency Level:      50
Time taken for tests:   5.151 seconds
Complete requests:      1000
Failed requests:        0
Total transferred:      35098000 bytes
HTML transferred:       34745000 bytes
Requests per second:    194.14 [#/sec] (mean)
Time per request:       257.542 [ms] (mean)
Time per request:       5.151 [ms] (mean, across all concurrent requests)
Transfer rate:          6654.33 [Kbytes/sec] received

Connection Times (ms)
              min  mean[+/-sd] median   max
Connect:       83   99   9.5     96     140
Processing:    80  147  35.1    144     284
Waiting:       54  122  35.0    118     258
Total:        169  246  38.0    242     406

Percentage of the requests served within a certain time (ms)
  50%    242
  66%    257
  75%    266
  80%    272
  90%    292
  95%    312
  98%    368
  99%    382
 100%    406 (longest request)
After indexing:
Concurrency Level:      50
Time taken for tests:   5.163 seconds
Complete requests:      1000
Failed requests:        0
Total transferred:      35098000 bytes
HTML transferred:       34745000 bytes
Requests per second:    193.69 [#/sec] (mean)
Time per request:       258.148 [ms] (mean)
Time per request:       5.163 [ms] (mean, across all concurrent requests)
Transfer rate:          6638.71 [Kbytes/sec] received

Connection Times (ms)
              min  mean[+/-sd] median   max
Connect:       87   99   9.3     96     141
Processing:    82  147  36.0    141     319
Waiting:       56  122  36.0    116     293
Total:        170  246  38.4    240     422

Percentage of the requests served within a certain time (ms)
  50%    240
  66%    256
  75%    267
  80%    277
  90%    297
  95%    315
  98%    346
  99%    364
 100%    422 (longest request)
Hmm, hardly difference, also tested with -k (keep-alive) and different concurrency levels.
Vector Tiles
One of the main questions is: in these modern times, the best starting point would be Vector Tiles, but...
- See https://github.com/mapbox/awesome-vector-tiles,
- interesting: https://github.com/mkeller3/FastVector,
- https://github.com/developmentseed/timvt
Service Toolchain
PostGIS-->pg_tileserv-->tileserver-gl-->MapProxy:
Specifics:
- PostGIS - table data and functions
pg_tileserv- use tables and functions to serve MVT tiles- NO MVT MBTiles file-caches (for now)
maptiler/tileserver-glfetches frompg_tileservmaptiler/tileserver-glrenders and serves raster tiles via WMTSMapProxyuses raster WMTS as Source(s)MapProxymay use transparent AHN hillshade overlay as Source(s) to overlayMapProxycreates mbtile-caches for raster tiles (as already in map5.nl)- alternatives to
pg_tileservare FASTVector [5] and TiMVT [6].
Questions:
- is there an (Open) alternative for
tileserver-gl? e.g. a tool that directly renders raster tiles from MVT. - can we do something with maplibre (-native)?
Data Preparation
See Tom van Tilburg article [1]. At least needed:
- feature reclassification for lower zooms
- geometry simplification
- aggregation/dissolving
- split up (large) polygons
Big question: follow existing OSM/Imposm data schemas or similar to Tom [1] and/or PDOK [2]? Or can this be solved by using BRT scales like Top1000, Top500 etc?
Many datasets available via geotoko.nl.
Aggregation
For lower zooms need to aggregate polygons into larger polygons. Also called "dissolving" or
Approaches:
Sandeep Dhakal
https://medium.com/@sandeep.dhakal/efficiently-dissolving-adjacent-polygons-by-attributes-in-a-large-gis-database-5492e54ef951
ICA - Cartagen
https://generalisation.icaci.org/
Morphological amalgamation = merging adjacent features based on their shape and size, while preserving topology and the visual morphology of the map.
https://cartagen.readthedocs.io/
https://github.com/LostInZoom/cartagen/
Tom van Tilburg - Geodan
JavaScript and TopoJSON in PostgreSQL!
- https://observablehq.com/@geodan/how-to-make-a-vectortile-basemap
- https://github.com/Geodan/plv8_geo
MapShaper
https://github.com/mbloch/mapshaper/wiki
Map Design
- classical topomap look,
- a simple and detailed version like OpenTopo/OpenSimpleTopo
- coloured and greyscale
- separate hillshading map, bare and with labels+roads
- may use OpenTopoMap [3] as starter? Classic toolchain: osm2pgsql, SQL and Mapnik
- or https://github.com/nst-guide/osm-liberty-topo [4]?
Tooling:
- using Maputnik? GeoStyler?
- seems that Mapbox GL/MapLibre GL is CartoCSS follow-up, and can all generate Mapnik styles (?)
CartoCSS + Kosmtik PoC - 14.07.2022
See git/research/carto.
CartoCSS,
originally from MapBox, is a higer level styling
language based on CSS (Less).
The carto command can generate a Mapnik XML file. This is
still used in the main OSM Map, with a style also called "Carto".
Kosmtik is mainly a server through which you can quickly see edits in CartoCSS. It is not a CartoCSS editor (as I thought). But still very useful to see edits, done in e.g. vi.
The Example
Very simple example with just water Dutch generalized Shapefile for demo.
- project in work/example1/project.yml.mml.
- style in work/example1/style.mss.
Carto
Using a Dockerfile:
./build.sh

Run the carto command to convert a CartoCSS project to Mapnik XML.
Usage: ./carto.sh "command line"
Examples:
./carto.sh "carto --version"

Files must have a .mss or .mml extension!
./carto.sh "carto example1/style.mss"
./carto.sh "carto example1/project.yml.mml"
./carto.sh "carto example1/project.yml.mml > example1/project.xml"
Kosmtik
Using an existing Docker Image and Bash script kosmtik.sh.
by https://github.com/Joxit/docker-kosmtik.
- script: https://github.com/Joxit/docker-kosmtik/blob/master/tools/kosmtik
- Docker Image: joxit/kosmtik from DockerHub
Thus:
./kosmtik.sh serve work/example1/project.yml.mml

browse http://0.0.0.0:6789
Change polygon color in style.mss, see almost instant changes
CartoCSS + Topo Style - 15.07.2022
If going the 'CartoCSS' way there is an enormous amount of styles to choose, as starting point. For example the official OSM slippy map uses a style called 'Carto', which is maintained by Andy Allan (Gravitystorm and Thunderforest) and community:
- https://github.com/gravitystorm/openstreetmap-carto
Now CartoCSS has many degrees of freedom how one structures the project file and style files.
MapBox developed a CartoCSS style called "OSM Bright" which may be used as a starter for specific styles:
- https://github.com/mapbox/osm-bright
The nice thing about "OSM Bright" is that it provides a very structured
file and style editing convention starting with
the 'project mml
which includes just four style (.mss) files:
- palette.mss - literally define you palette as symbolic vars: colors fonts etc.
- base.mss basic styles for landuse, water, admin boundaries
- roads.mss - how to style alle roads
- labels.mss - all labels
These styles can be edited with TileMill. TileMill is more advanced than Kosmik (see above) in that it can provide editing on-the-fly. But still an export to Mapnik is eventually possible.
One example of a topographic "OSM Bright" based style is:
- https://github.com/duvifn/jnet_style
Not actively maintained, but may be good starting point.
Tilemill: recent, via Docker file: https://github.com/schachmett/docker-tilemill See: https://simon-fischer.info/2020/12/09/run-tilemill-in-a-docker-container/
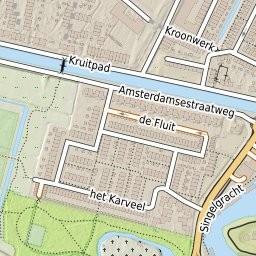
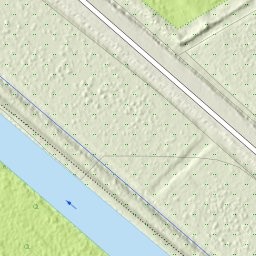
PNG vs JPEG tiles - 17.07.2022
JPEG is a better choice, especially for tiles with lots of detail like hillshading. This finding also came out of map5 development for the OpenTopo map, see Justs Blog on JPEG is Dead, long live JPEG.
A small experiment with the map5topo map gave similar results:
- same image quality
- PNG 8 bit: too low quality for rich coloured map
- JPEG image about 4 times as small as PNG (24 bit)
- and: image generation, overall turnaround time in browser: JPEG twice as fast!
So the choice is clear: use JPEG but with higher quality in encoding. This is like with OpenTopo, arranged in MapProxy config:
# image/transformation options
image:
# resampling_method: nearest
resampling_method: bilinear
paletted: true
formats:
  # UNUSED
  png8:
    format: image/png
    colors: 256

  png24:
    format: image/png; mode=24bit
    colors: 0

  image/jpeg:
    encoding_options:
      jpeg_quality: 90
Below some results from tiles in JPEG and PGN24.
Zoom 11:
PNG
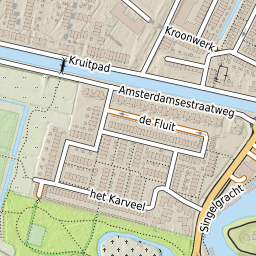
JPEG
Zoom 13:
PNG
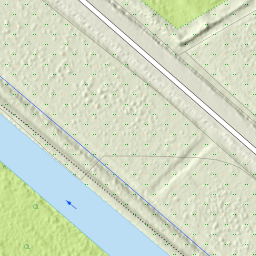
JPEG
See changes in Mapnik style files directly
Requirement: need a mechanism to directly see the results in map images when changes made in Mapnik style files. Similar to Kosmtik and TileMill. We can then easily make an HTML page showing images or with a map-viewer that has permalinks in the address-bar. Or even a primitive edit app!
Our "engine" is MapProxy: it generates map images via WMS, TMS or WMTS from the Mapnik styles. This is the first choice. Investigate what can be done, otherwise need dedicated software like a WMS server directly on Mapnik styles. There is a Mapnik OGC Server, but would take quite some effort to get working is expected. Or we need to develop ourselves.
But we need to tackle some problems using MapProxy:
- caching: so changes are not visible unless removing cache
- MapFile object reuse: the (enhanced) Mapnik soure backend for MapProxy caches Mapfile objects
The first problem can be solved by making a dedicated "direct" layer in MP config like:
layers:
    - name: map5topo
    title: Map5 Topomap - powered by map5.nl
    sources: [ map5topo_cache ]

    - name: map5topo_direct
    title: Map5 Topomap - direct - no cache
    sources: [ map5topo_no_cache ]
.
.
caches:

    map5topo_no_cache:
        grids: [ dutch_grid_lev13, webmerc_grid_lev19 ]
        sources: [ map5topo_source ]
        disable_storage: true
        format: image/jpeg
        meta_buffer: 64
        meta_size: [ 4,4 ]
        upscale_tiles: 4
Now tiles are always newly generated.
Second problem is caching of Mapnik objects (the parsed XML) in the Mapproxy mapnik.py. We use a file from a MP PR that caches Mapnik objects. Solution: have that Python code use watchdog from pypi.
Refactor Scale Delineation
This determines the Rules that are 'hit' per scale range. The initial list assumes Web Mercator scales (at equator 0.28 mm per pixel). This does not match RD scales (resolutions) defined in the Geonovum tiling scheme. In some cases multiple resolutions will fall in a single scale range. This may have lead to multiple Rules being fired, maybe that was the reason for the performance penalty (?).
Like done in Map5 for OpenTopo, TopRaster and more, define scale ranges where each range captures a single zoom/resolution for both WebMerc and RD tiling. ALso reflect this in Entity naming.
Original from OpenTopoMap and OSM in general:
<!ENTITY maxscale_zoom0 "<MaxScaleDenominator>250000000000</MaxScaleDenominator>">
<!ENTITY maxscale_zoom1 "<MaxScaleDenominator>500000000</MaxScaleDenominator>">
<!ENTITY minscale_zoom1 "<MinScaleDenominator>200000000</MinScaleDenominator>">
<!ENTITY maxscale_zoom2 "<MaxScaleDenominator>200000000</MaxScaleDenominator>">
<!ENTITY minscale_zoom2 "<MinScaleDenominator>100000000</MinScaleDenominator>">
<!ENTITY maxscale_zoom3 "<MaxScaleDenominator>100000000</MaxScaleDenominator>">
<!ENTITY minscale_zoom3 "<MinScaleDenominator>50000000</MinScaleDenominator>">
<!ENTITY maxscale_zoom4 "<MaxScaleDenominator>50000000</MaxScaleDenominator>">
<!ENTITY minscale_zoom4 "<MinScaleDenominator>25000000</MinScaleDenominator>">
<!ENTITY maxscale_zoom5 "<MaxScaleDenominator>25000000</MaxScaleDenominator>">
<!ENTITY minscale_zoom5 "<MinScaleDenominator>12500000</MinScaleDenominator>">
<!ENTITY maxscale_zoom6 "<MaxScaleDenominator>12500000</MaxScaleDenominator>">
<!ENTITY minscale_zoom6 "<MinScaleDenominator>6500000</MinScaleDenominator>">
<!ENTITY maxscale_zoom7 "<MaxScaleDenominator>6500000</MaxScaleDenominator>">
<!ENTITY minscale_zoom7 "<MinScaleDenominator>3000000</MinScaleDenominator>">
<!ENTITY maxscale_zoom8 "<MaxScaleDenominator>3000000</MaxScaleDenominator>">
<!ENTITY minscale_zoom8 "<MinScaleDenominator>1500000</MinScaleDenominator>">
<!ENTITY maxscale_zoom9 "<MaxScaleDenominator>1500000</MaxScaleDenominator>">
<!ENTITY minscale_zoom9 "<MinScaleDenominator>750000</MinScaleDenominator>">
<!ENTITY maxscale_zoom10 "<MaxScaleDenominator>750000</MaxScaleDenominator>">
<!ENTITY minscale_zoom10 "<MinScaleDenominator>400000</MinScaleDenominator>">
<!ENTITY maxscale_zoom11 "<MaxScaleDenominator>400000</MaxScaleDenominator>">
<!ENTITY minscale_zoom11 "<MinScaleDenominator>200000</MinScaleDenominator>">
<!ENTITY maxscale_zoom12 "<MaxScaleDenominator>200000</MaxScaleDenominator>">
<!ENTITY minscale_zoom12 "<MinScaleDenominator>100000</MinScaleDenominator>">
<!ENTITY maxscale_zoom13 "<MaxScaleDenominator>100000</MaxScaleDenominator>">
<!ENTITY minscale_zoom13 "<MinScaleDenominator>50000</MinScaleDenominator>">
<!ENTITY maxscale_zoom14 "<MaxScaleDenominator>50000</MaxScaleDenominator>">
<!ENTITY minscale_zoom14 "<MinScaleDenominator>25000</MinScaleDenominator>">
<!ENTITY maxscale_zoom15 "<MaxScaleDenominator>25000</MaxScaleDenominator>">
<!ENTITY minscale_zoom15 "<MinScaleDenominator>12500</MinScaleDenominator>">
<!ENTITY maxscale_zoom16 "<MaxScaleDenominator>12500</MaxScaleDenominator>">
<!ENTITY minscale_zoom16 "<MinScaleDenominator>5000</MinScaleDenominator>">
<!ENTITY maxscale_zoom17 "<MaxScaleDenominator>5000</MaxScaleDenominator>">
<!ENTITY minscale_zoom17 "<MinScaleDenominator>2500</MinScaleDenominator>">
<!ENTITY maxscale_zoom18 "<MaxScaleDenominator>2500</MaxScaleDenominator>">
<!ENTITY minscale_zoom18 "">
This was changed to:
<!ENTITY maxscale_zoom0 "<MaxScaleDenominator>250000000000</MaxScaleDenominator>">
<!ENTITY maxscale_zoom1 "<MaxScaleDenominator>500000000</MaxScaleDenominator>">
<!ENTITY minscale_zoom1 "<MinScaleDenominator>200000000</MinScaleDenominator>">
<!ENTITY maxscale_zoom2 "<MaxScaleDenominator>200000000</MaxScaleDenominator>">
<!ENTITY minscale_zoom2 "<MinScaleDenominator>100000000</MinScaleDenominator>">
<!ENTITY maxscale_zoom3 "<MaxScaleDenominator>100000000</MaxScaleDenominator>">
<!ENTITY minscale_zoom3 "<MinScaleDenominator>50000000</MinScaleDenominator>">
<!ENTITY maxscale_zoom4 "<MaxScaleDenominator>50000000</MaxScaleDenominator>">
<!ENTITY minscale_zoom4 "<MinScaleDenominator>25000000</MinScaleDenominator>">
<!ENTITY maxscale_zoom5_rd0 "<MaxScaleDenominator>25000000</MaxScaleDenominator>">
<!ENTITY minscale_zoom5_rd0 "<MinScaleDenominator>12000000</MinScaleDenominator>">
<!ENTITY maxscale_zoom6_rd1 "<MaxScaleDenominator>12000000</MaxScaleDenominator>">
<!ENTITY minscale_zoom6_rd1 "<MinScaleDenominator>6000000</MinScaleDenominator>">
<!ENTITY maxscale_zoom7_rd2 "<MaxScaleDenominator>6000000</MaxScaleDenominator>">
<!ENTITY minscale_zoom7_rd2 "<MinScaleDenominator>2400000</MinScaleDenominator>">
<!ENTITY maxscale_zoom8_rd3 "<MaxScaleDenominator>2400000</MaxScaleDenominator>">
<!ENTITY minscale_zoom8_rd3 "<MinScaleDenominator>1200000</MinScaleDenominator>">
<!ENTITY maxscale_zoom9_rd4 "<MaxScaleDenominator>1200000</MaxScaleDenominator>">
<!ENTITY minscale_zoom9_rd4 "<MinScaleDenominator>600000</MinScaleDenominator>">
<!ENTITY maxscale_zoom10_rd5 "<MaxScaleDenominator>600000</MaxScaleDenominator>">
<!ENTITY minscale_zoom10_rd5 "<MinScaleDenominator>300000</MinScaleDenominator>">
<!ENTITY maxscale_zoom11_rd6 "<MaxScaleDenominator>300000</MaxScaleDenominator>">
<!ENTITY minscale_zoom11_rd6 "<MinScaleDenominator>150000</MinScaleDenominator>">
<!ENTITY maxscale_zoom12_rd7 "<MaxScaleDenominator>150000</MaxScaleDenominator>">
<!ENTITY minscale_zoom12_rd7 "<MinScaleDenominator>80000</MinScaleDenominator>">
<!ENTITY maxscale_zoom13_rd8 "<MaxScaleDenominator>80000</MaxScaleDenominator>">
<!ENTITY minscale_zoom13_rd8 "<MinScaleDenominator>40000</MinScaleDenominator>">
<!ENTITY maxscale_zoom14_rd9 "<MaxScaleDenominator>40000</MaxScaleDenominator>">
<!ENTITY minscale_zoom14_rd9 "<MinScaleDenominator>20000</MinScaleDenominator>">
<!ENTITY maxscale_zoom15_rd10 "<MaxScaleDenominator>20000</MaxScaleDenominator>">
<!ENTITY minscale_zoom15_rd10 "<MinScaleDenominator>10000</MinScaleDenominator>">
<!ENTITY maxscale_zoom16_rd11 "<MaxScaleDenominator>10000</MaxScaleDenominator>">
<!ENTITY minscale_zoom16_rd11 "<MinScaleDenominator>5000</MinScaleDenominator>">
<!ENTITY maxscale_zoom17_rd12 "<MaxScaleDenominator>5000</MaxScaleDenominator>">
<!ENTITY minscale_zoom17_rd12 "<MinScaleDenominator>2500</MinScaleDenominator>">
<!ENTITY maxscale_zoom18_rd13 "<MaxScaleDenominator>2500</MaxScaleDenominator>">
<!ENTITY minscale_zoom18_rd13 "<MinScaleDenominator>1250</MinScaleDenominator>">
<!ENTITY maxscale_zoom19 "<MaxScaleDenominator>1250</MaxScaleDenominator>">
<!ENTITY minscale_zoom19 "">
Needs testing if this really captures wht is intended. E.g. the Entity
range minscale_zoom10_rd5-maxscale_zoom10_rd5
schould be the range for WebMerc Zoom 10 and RD 5.
Refs
- [1] https://observablehq.com/@geodan/how-to-make-a-vectortile-basemap
- [2] https://www.pdok.nl/-/vector-tiles-brt-en-bgt-via-pdok
- [3] https://github.com/der-stefan/OpenTopoMap
- [4] https://github.com/nst-guide/osm-liberty-topo
- [5] https://github.com/mkeller3/FastVector
- [6] https://github.com/developmentseed/timvt
